In this article, I’ve identified some essential Google Analytics reports that every marketer should know.
You know that your website is important. You’ve done your research. You’ve targeted your keywords. And when you were confident that it couldn’t be any more perfect, you unleashed your small business site to your eagerly-awaiting customers.
Now what? Do you sit back, relax, and wait for customers to start flocking to your business? Oh no! You’re just getting started. It’s time to start tracking your site’s performance, to see what’s working, and what’s not.
It’s time to install Google Analytics.
Google Analytics is a freemium service that you set up using your Google account. That means it’s completely free to use, although they do offer some more in-depth options for the truly data-orientated among us. But for most small businesses the standard (free) Google Analytics is more than enough.
It’s worth mentioning that even if you’re not 100% certain that you want to dive into Google Analytics right away, it’s in your best interest to create your account and start tracking your website data now. This will provide you with a baseline so even if you take some time to focus on other things, Google Analytics is happily working in the background and will give you a complete picture when you do begin to run reports on your site.
Reports? What reports?
Google Analytics collects an amazingly vast amount of information on your site’s performance, your visitor’s, and their usage. To make sense of the data, you can generate reports that are as high-level or granular as you need. It can be easy to get lost in the data, which is why I’ve identified 6 Google Analytics reports that every marketer should know.
#1 The Source/Medium Report
This report gives you a great first look at where your website traffic is coming from. The source is the origin of the traffic, and could be anything from Google to Facebook, to a loyal customer who raves about you on their blog. The medium refers to the general category – a referral link, organic search traffic, or paid click-through ad link.
You can access the Source/Medium Report by clicking Aquisition -> All Traffic -> Source/Medium.

As seen in the image above, this report shows where your visitors originated from, such as search engines, social networks or referrals. It is important to closely monitor this report to determine which online marketing strategy is generating visitors to your site. For example, you may notice that the Google Ads you are running are generating fewer sessions than Social but are staying on the site for the longer periods of time and converting more. This may lead you to change up your social strategy and targeting to attract users that are more likely to stay on your page for a longer period and convert more.
#2 The Mobile Performance Report
The good old days of desktop website surfing are quickly being overshadowed by mobility devices. Your customers are on the go, and they’re looking up your website on their phones and tablets more than ever. If you haven’t optimized your site for these smaller screens, you’re doing your customers and your business a huge disservice.
The Mobile Performance Report offers you a quick breakdown of your site’s performance on mobile devices while providing suggestions for things that might help improve it. You can even segment your mobile users further and look at the types of devices and browsers.
You can access the Mobile Performance Report by clicking Audience -> Mobility -> Overview.

Important metrics to look at within this report are as follows:
Visitors – What percentage of your visitors are from mobile compared to desktop?
Using the source/medium secondary dimension you can dig deeper and understand where your mobile customers are coming from compared to desktop visitors. This will allow you to see any discrepancies between mobile and desktop traffic sources. This information will provide valuable insight to determine if you should focus on a particular traffic source with your mobile strategy.
For example, let’s say you notice that only desktop users are clicking through on your Google Ads campaign. This gives you prime information in which you should switch up your Google Ads campaign and have target mobile devices only with different ad copy and keywords and extensions, etc.
Bounce Rate – Is there a significant difference in the bounce rate in comparison to desktop?
If there is a higher bounce rate for mobile users compared to desktop users, you should make sure visitors can access the content with ease and navigate through multiple pages or zoom in on their screen to navigate. To find out you can also compare the landing page bounce rate, page depth, and average time on page compared to desktop.
You can use the comparison tool in this report which will show you how a metric is performing compared to the site average. The positive results are shown in green and the negative results are shown in red
Keywords – Is there a significant difference in search terms?
It is critical that you start comparing the top mobile search terms to the top desktop search terms to determine if there is a discrepancy. If you notice a discrepancy, the first step is to understand what your mobile users are searching and provide them with more content related to those search terms. You can also launch a separate site approach, that will allow you to better optimize for these keywords.
#3 The Behaviour Overview Report
While the first two reports give you an idea of where your traffic is coming from, and what their mobile experience is like, the Behaviour Overview Report highlights what your users are actually doing once they get to your site! It’s important to know what pages are popular with your customers, and look at the ones that are not, so you can determine the reason for these weaker pages and correct it.
You can access the Behaviour Overview Report by clicking Behavior -> Overview.

As seen in the image above, the behavior overview report provides a graph that will show you the amount of traffic your website receives and other important metrics such as:
Pageviews – This metric looks at the total of the number of pages that were viewed on your website. This number also includes repeated views of a single page. For example, a user may view your services page followed by the contact page and then return to the services page. Therefore, each view is counted as a page view.
Unique Pageviews – This is the number of individual users that viewed a certain page on your website during a visit. Using the example above with the pageviews, where the user viewed the service page more than once during a single visit, this is one counted as one unique pageview rather than 3-page views because only the original view is counted as a unique pageview.
Avg. Time on Page – This metric examines the amount of time each user spent viewing a particular page on your website. If user seems to spend very little time on a particular page, try adding more content such as high-quality images and videos for a more interactive experience and improve the readability of your content.
I will look at Bounce Rate and % Exit later in this article.
#4 The New vs Returning Customer Report
Attracting new visitors to your site might be the hardest part, but you also want to know when you have repeat users. These are the people who will eventually become your super fans! If you are seeing a very low returning customer value, this might indicate a problem with the content on your site. Maybe you’re attracting the wrong audience, or maybe your site’s content quality doesn’t live up to their expectations.
You can access the New vs Returning Customer Report by clicking Audience -> Bahaviour -> New vs Returning.

As seen in the image above this report contains percentages of new vs returning users to your website. There are some important factors what to look for in this report.
Besides from the obvious factor of the percentage comparison you can dig deeper and find more valuable information such as, which channels are delivering new users to the site and compared to how returning visitors are getting to the site. To find this information, add in the source/medium secondary dimension. You can also compare which landing page brings in the majority of new visitors and compare it to the pages that returning users visit.
#5 The Age/Gender Report
Speaking of attracting the wrong audience to your website, this handy Google Analytics report will answer the question of who your audience is… and if it matches your business’ target demographic. If you sell services geared toward women aged 45-60 yet this report indicates most visitors are men 18-30, it doesn’t matter how many visitors are coming to your site. If they’re not the right audience, your conversion rate is going to be potentially low. This gives you the opportunity to tweak the content in a way that will improve your sales. You can also drill down into the data, even more, to see which groups have higher engagement, showing bounce rates, time on site, pages visited, etc.
You can access the Age/Gender Report by clicking Audience -> Demographics -> Overview.
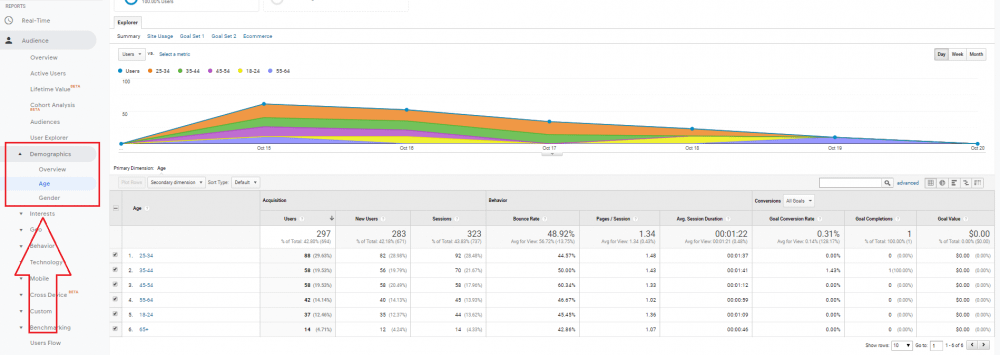
Looking at the screengrab above taken from Google Analytics, each age group is represented by a different color. This graph will help you see different patterns and changes in each age group which can help you locate your largest market as well as new opportunities. For example, in the graph above you can see that this website gets very little traffic from users aged 55-64. Therefore, they can begin to create content more tailored to this age group to possibly generate new business.
You can also find out which age groups are most valuable to your website and how people of different ages engage with your content and convert in different patterns
#6 The Bounce Rate vs Exit Rate Report
As much as you want them to, your visitors can’t stay on your website forever. They have to leave at some point. The big question about how they leave. That’s why this report is so critical. It measures your site’s Bounce Rate compared to its Exit Rate. A Bounce Rate is the percentage of visitors who leave your site without taking any action. They come, they don’t like what they see, and they immediately leave. Although it is extremely unlikely to never have any bounces from your website, you want to see as low a percentage as possible. On the other hand, the Exit Rate measures the percentage of users who visit at least one other page before exiting your site. You want this number to be much higher than the bounce rate.
You can access the Bounce Rate vs Exit Rate Report by clicking Behaviour -> Site Content -> All Pages.

If you examine this report and notice that your products or services pages have a high bounce rate and % exit, you may want to change these pages. You should first look at who is leaving your website? Is it your target audience or other demographics. Is the page they are leaving on providing value? Consider adjusting the content or adding high-quality images and videos to make the site more interactive and appealing to users. You can look at your top performing pages and reuse the formatting and style of the content. You can also double check to ensure that you are not getting traffic from non-targeted keywords.
However, there are some instances where a high percentage of exits may not be a big issue. For example, on your contact page, you may have listed your address and contact information such as email and phone number that users are searching for and may convert in a different way.
In Conclusion
Google has given webmasters access to an incredible amount of information. This free tool should be one of the pillars of any successful online marketing strategy, but like any tool, it is only useful if used effectively. With so much data available, it can be overwhelming, but by creating these 6 essential reports, you can quickly spot trends and make corrections.
Do you use Google Analytics? Do you have a favorite report that you don’t see on my list? Leave a comment below!